Quarterly July 2025: Push to consumption – Structural or Cyclical?
Despite increased tariff led and geopolitical uncertainties, buy the dip, still looks to be the preferred trade for the markets. US markets recovered 25% from the April lows and India is up 14% in USD terms. Either the markets believe that adoption of AI will result in massive productivity gains in the medium to long term or they are complacent at present, and the rising global risks will manifest in weaker economic data and earnings in latter half of 2025. The bottom line is that global uncertainties will continue to persist.
India’s macro conditions are conducive to sustaining a 6.5-6.7% GDP growth. The market earnings growth is likely to be 13-14%. Given that the markets are trading at the higher end of valuation range, returns would be driven by more earnings growth. Any global shock remains a downside risk. Being macro-aware is important but our job as bottom-up investors is to keep our focus on long-term earning potential of the businesses we are evaluating and their intrinsic value. We continue to look for sustainable growth at reasonable valuation.
The recent tax cuts and peaking of interest rates is driving excitement towards the consumption story in India. We have a closer look at the potential consumption boost and evaluate if it will be cyclical or structural?
Global markets buying the DIP is still favoured strategy
| Global Indices Performance (USD) | Uncertainty
Jan 1–Apr 8 |
Tarriff Paused
Apr 8–Jun 30 |
YTD | 12 Months |
| Developed Markets | ||||
| S&P 500 – USA | -15% | 25% | 5% | 14% |
| NASDAQ – USA | -21% | 33% | 5% | 15% |
| FTSE100 – UK | -1% | 19% | 18% | 17% |
| DAX – Germany | 8% | 27% | 37% | 44% |
| Nikkei 225 – Japan | -11% | 25% | 11% | 14% |
| Kospi – Korea | -3% | 44% | 39% | 12% |
| HSI – HK | 0% | 18% | 19% | 35% |
| Developing Markets | ||||
| Nifty – India | -5% | 14% | 8% | 3% |
| SHCOMP – China | -7% | 12% | 5% | 18% |
| IBOV – Brazil | 6% | 24% | 31% | 15% |
| Jakarta – Indonesia | -19% | 20% | -3% | -1% |
Source: ELC, Bloomberg, ACE Equity
Sector rotation to underperforming sectors YTD

Source: ELC, Bloomberg, ACE Equity
Indian GDP to grow at 6.5%
The Indian macro looks stable, fiscal deficit is on a downward trajectory, inflation is under control, RBI has front loaded interest rate cuts by a sharp 50bps to stimulate the economy. Barring external shocks, a 6.5% – 6.7% GDP growth is likely to sustain.
| FY18 | FY19 | FY20 | FY21 | FY22 | FY23 | FY24 | FY25E | FY26E | |
| Real GDP growth % | 6.8 | 6.5 | 3.9 | (5.8) | 9.7 | 7.0 | 8.2 | 6.5 | 6.2 |
| Fiscal deficit % of GDP | (3.5) | (3.4) | (4.6) | (9.2) | (6.7) | (6.5) | (5.9) | (4.8) | (4.4) |
| Current Account % of GDP | (1.8) | (2.1) | (0.9) | 0.9 | (1.2) | (2.0) | (0.7) | (0.6) | (1.0) |
| GFCF % of GDP | 28.2 | 29.5 | 28.5 | 27.3 | 29.6 | 30.7 | 30.8 | 30.0 | 30.0 |
| CPI growth % | 3.6 | 3.4 | 4.8 | 6.2 | 5.5 | 6.7 | 5.4 | 4.6 | 3.5 |
| 10-Year Note % – YE | 7.4 | 7.4 | 6.1 | 6.2 | 6.8 | 7.3 | 7.1 | 6.6 | 6.3 |
| USDINR – Average | 64.5 | 69.9 | 70.9 | 74.2 | 74.5 | 80.4 | 82.8 | 84.6 | 86.6 |
| INR depreciation % | 4.1 | (7.8) | (1.4) | (4.5) | (0.4) | (7.3) | (2.9) | (2.1) | (2.3) |
Source: ELC, MOSPI, RBI, Kotak
Earning growth at 13-14% going forward
After a sharp 20% earnings CAGR from FY20-25, consensus expects a 13-14% growth going forward. CY26 earnings are still being downgraded but the real question is that will there be upgrades going forward.
| Earnings expected to grow at 12-14% | Positive earnings revision for CY27 |
 |
 |
Source: ELC, MOSL, Bloomberg, Avendus Spark
Domestic institutions are the larger buyers with FII’s still net sellers of equities. Buy on dips still seems to be the theme for retail investors. Market valuations are at higher end of the trading range. With limited re-rating potential earnings growth will be the key factor that drives the returns going forward.
| FII outflows of $9bn in first half of CY25 | Valuations at the higher end of trading range |
 |
 |
Source: ELC, MOSL
A US$90bn (2% of GDP) potential boost to consumption over next 3 years:
India is a domestic consumption driven economy with private consumption accounting for 60% of the GDP. Post covid the pick-up in consumption has been slow and the government through tax and interest rate cuts is trying to provide a boost to consumption. The coming revision in salaries of government employees in FY27 (an exercise undertaken every 10 years) will likely provide a further impetus to the consumption story. These factors will clearly provide a cyclical boost to consumption in the near-term. However to grow the consumer base beyond 50-60m consumers for larger ticker items will require a sustained growth in per capita GDP.
Cyclical tailwinds for India’s consumption: A potential Rs 6.0trn of income/demand stimulus opportunity:
Estimated ₹6 Trillion Demand Stimulus: Key Drivers
| Component | Estimated Value | Impact |
| Personal Income Tax Cuts | ₹1.1 trillion | Higher disposable income for 13mn middle-class households |
| EMI Savings from Rate Cuts | ₹0.6 trillion | Savings from a 100-bps decline in interest rates |
| Central Pay Commission Hike | ₹4.0+ trillion | FY27 salary boost for 31 million employees and pensioners |
#1. Income tax cut of INR 1.1trn implies higher disposable income in hands of consumers: Tax cut gives substantial savings or increases annual disposable income by INR 80k to INR 110k for 13mn consumers.
#2. Interest Rate Cuts: The rate-cuts would primarily impact the retail loans portfolio of ~INR 90 trillion across 115 Mn loans (25 Mn home loans, 16 Mn auto loans, 74 Mn MSME Individual loans). The impact of 100 bps rate-cut to INR 50 Bn EMI savings per month / INR 0.6 trn in annual savings
#3. 8th Central Pay commission revision – A potential hike in wages in 2026: India 8th CPC is due in Jan 2026, which happens every decade. About 18 mn employees and 13 mn pensioners will benefit from salary hike. A 15% hike in salary would translate to additional INR 3.7 trillion (1% of GDP) salary to government employees and pensioners.
| Previous hike has been in the range 23-45% | 8th Pay Commission potential wage hike impact | ||||||||||||||||||||||||||||||||
|
|
Source: ELC
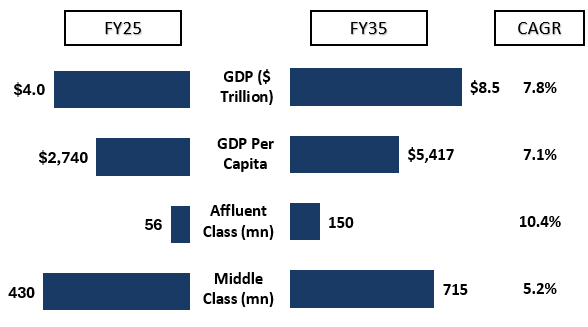
Out of the total 500mn addressable population, only 50-60m consumers account for majority off higher end consumption. A sustained GDP growth is must for growing this consumption pie.
| India real customer base is 50-60 mn | India outlook in next 10 years |
 |
 |
A cyclical upturn likely for consumption – how much is already reflected in price?
| Company | Mcap | CAGR FY25-28 | EBITDA Margin | P/E 2FY | P/E 2FY – 10-YR | ||||||
| (Rs bn) | Rev | PAT | FY25 | FY27 | Peak | Trough | Current | Avg | Trough | Peak | |
| Consumer Staples | |||||||||||
| HUL | 5,421 | 8% | 9% | 24% | 24% | 25% | 12% | 46x | 48x | 33x | 56x |
| Marico | 922 | 9% | 11% | 20% | 21% | 21% | 9% | 45x | 39x | 30x | 48x |
| Consumer Discretionary | |||||||||||
| Titan | 3,289 | 14% | 26% | 9% | 11% | 12% | 8% | 53x | 52x | 30x | 73x |
| Dmart | 2,858 | 19% | 17% | 8% | 8% | 9% | 4% | 70x | 63x | 50x | 85x |
| Trent | 2,212 | 27% | 37% | 16% | 16% | 16% | -2% | 71x | 68x | 30x | 105x |
| Metro Brands | 308 | 16% | 20% | 30% | 32% | 32% | 17% | 56x | 58x | 45x | 68x |
| Vedant Fashions | 195 | 13% | 13% | 46% | 47% | 50% | 25% | 40x | 52x | 35x | 65x |
| QSR | |||||||||||
| Jubilant | 466 | 15% | 50% | 19% | 21% | 25% | 10% | 80x | 50x | 39x | 88x |
| Devyani | 205 | 15% | 197% | 17% | 19% | 23% | 17% | 108x | 75x | 45x | 115x |
| Westlife | 118 | 16% | 144% | 13% | 16% | 17% | 5% | 98x | 89x | 47x | 125x |
| Consumer Electronics | |||||||||||
| Havells | 972 | 14% | 18% | 10% | 11% | 15% | 9% | 46x | 43x | 28x | 61x |
| Blue Star | 361 | 13% | 12% | 7% | 7% | 9% | -1% | 45x | 30x | 24x | 55x |
| Voltas | 441 | 9% | 17% | 7% | 7% | 10% | 4% | 39x | 31x | 22x | 55x |
| Auto | |||||||||||
| Maruti Suzuki | 3,968 | 11% | 11% | 12% | 12% | 15% | 6% | 22x | 23x | 18x | 31x |
| Hyundai Motors | 1,726 | 10% | 10% | 13% | 13% | 13% | 6% | 24x | 23x | 18x | 26x |
Source: ELC, Bloomberg
As always, macro awareness remains crucial, but bottom-up stock selection will continue to rely on identifying businesses with strong long-term earnings potential and reasonable valuations. Let me illustrate our approach to investing through an example of a stock we own in our portfolio,
Aditya Vision (Mcap INR 46 bn): We own Aditya Vision, an electronic retailer in eastern India in our portfolios. The stock corrected 16% last quarter. We continue to own the stock but the significant correction in the stock price made us re-assess our thesis – about the company.
Aditya Vision started as a single shop and is a leading electronics chain across Bihar, Jharkhand and eastern UP. It has 175 stores outside busy bazaars. It is benefiting from penetration story of air conditioners in populous but low-income markets of Bihar, UP and Jharkhand.
The management is confident of adding 40-50 stores per annum which can take the store count to 275-300 stores over 5 years. Bihar and Jharkhand can still absorb 40-50 additional stores each; UP has room for another 200-250. Post which, Odisha and Chhattisgarh will be the target for growth.
Store economics: Each outlet costs roughly INR8m to build and INR25-30m in working capital. Once stabilised, it clocks INR15-17 mn in annual sales, earns a 15 % gross margin and about 8 % EBITDA, and nets INR7-8 mn in PAT.
Why superior margins compared to other electronic retailers: Aditya Vision’s superior EBITDA margin stems from a product mix that caps low‐margin mobiles and laptops at about 20 % of sales (versus 35–60 % for rivals), location in under-penetrated towns with less organised competition, and a lean cost structure
How is the B/S: Borrowing is 10-15 % of annual sales, short-term debt taken only to stock up inventory ahead of the summer peak or festival seasons
What are the risks: Heavy seasonality, up to 40% of annual sales are in summer quarter, making earnings sensitive to a weak or shortened heatwave and still-unproven rollouts in new territories such as UP, Odisha and Chhattisgarh
Near-term bump: Early monsoon has impacted demand for air conditioners, OEMs expect 20-25 % declines, but in Aditya Vision’s under-penetrated markets revenue should grow 5-10% this year. With normalised weather, steady store adds could lift profit from about INR00cr in FY-25 to INR175-250 cr over 3-5 years.
Business Model: In electronics retail, return on capital hinges on three levers: inventory turns, gross margin and cost control. Aditya Vision delivers a 20 % ROE with EBITDA margins of 8–9 %. Its Inventory turn is 4-5x.
|
|