Quarterly Oct 2025: Rising volatility
Profits compound Macros do not compound – Peter Lynch
Both gold and global equity markets have delivered strong performance YTD. Gold represents fear and has been going up given rising geopolitical tensions, deglobalisation and fear of USD losing its value. On the other hand, global equity (symbol for greed) has also reported strong performance driven by rising investments in Artificial Intelligence and its promise of productivity gains sustaining the goldilocks scenario. There is a risk that like all other previous big technology shifts we end up in a bubble before the fruits of the new technology are delivered. Is it a bubble or we are still in early stage of investment cycle is the key debate.
Indian markets have been lacklustre down 7% over last quarter and flat YTD in USD terms. Markets have weighed down by concerns related to shifting geopolitical situation (India has been on the receiving end of US tariffs), lack of pick-up in private capex and sluggish earnings. There was a big hope of China +1 emerging as a key driver for manufacturing sector. However, imposition of 50% tariffs by US on Indian exports has been a negative surprise. In the short-term these tariffs could have a 0.6-0.7% negative impact on GDP. Government has tried to counter this GST cuts to the tune of 0.7% of GDP to revive consumption. India’s macro balance sheet is in reasonable health, and the belief is that a trade deal with US will get finalised in the next 3-4 months. India will sustain a GDP growth of 6-6.5%.
Given the rising uncertainties the markets are likely to remain volatile. Earning cycle has been weak but bottoming out. Markets are still trading at higher end of the valuations. In this environment our focus remains on long-term. We continue to look for businesses with good growth opportunity trading at reasonable valuations.
Gold, bitcoin and Europe and Japan have outperformed YTD
| Global Indices Performance (In USD) | 3 Months | 12 Months | YTD | CY19-24 |
| Developed Markets | ||||
| S&P 500 – USA | 8% | 16% | 14% | 107% |
| NASDAQ – USA | 11% | 25% | 17% | 153% |
| FTSE100 – UK | 5% | 14% | 23% | 26% |
| DAX – Germany | -1% | 30% | 36% | 89% |
| Nikkiei 225 – Japan | 8% | 15% | 20% | 39% |
| Kospi – Korea | 8% | 24% | 50% | 28% |
| HSI – HK | 13% | 27% | 34% | -5% |
| Developing Markets | ||||
| Nifty – India | -7% | -10% | 0% | 63% |
| SHCOMP – China | 13% | 15% | 19% | 24% |
| IBOV – Brazil | 7% | 14% | 41% | -4% |
| Jakarta – Indonesia | 13% | -3% | 10% | 6% |
| Gold | 17% | 46% | 47% | 154% |
| Bitcoin | 7% | 80% | 22% | 1502% |
Source: ELC, Bloomberg
Defence and beneficiaries of recent GST cuts outperforming YTD

Source: ELC, Bloomberg, ACE Equity
India’s macros remain stable, GDP growth of 6.5% expected to sustain
Fiscal deficit likely to be in control
US tariffs can have a negative 0.7% impact on GDP. Government has cut GST rates to the tune of 0.6% of GDP to boost consumption. This has been done to counter the impact of tariffs. There is unlikely to be any significant impact on fiscal deficit due to these moves. Government has a few levers like cut down in some of the announced schemes, higher dividend from RBI to keep the fiscal deficit in control.
Front loaded cut in interest rates and surplus liquidity in the system
The RBI has held the repo rate at 5.5% after a cumulative 100 bps cut earlier this year. With inflation down to 2%, the RBI has signalled openness to further rate cuts if price pressures stay low. Banking system liquidity stayed in surplus RBI’s variable rate repo auctions and upcoming 75 bps CRR cut are expected to restore surplus and support monetary transmission.
Currency depreciation to provide some cushion to exporters
The Indian rupee has depreciated by ~3.5% against USD in the past six months, with steeper declines against the British pound and Euro – underperforming most global currencies, many of which have appreciated. The RBI has allowed measured depreciation to preserve competitiveness, while remaining prepared to intervene against sharp volatility.
Longer-term further reforms and resolution of US tariff issue remain critical. India needs to participate more in the supply chain to US as well as other markets and protect the services exports. If the trade deal with US is not concluded in the next 3-4 months it may impact FY27 growth.
| FY18 | FY19 | FY20 | FY21 | FY22 | FY23 | FY24 | FY25E | FY26E | |
| Real GDP growth % | 6.8 | 6.5 | 3.9 | (5.8) | 9.7 | 7.0 | 8.2 | 6.5 | 6.8 |
| Fiscal deficit % of GDP | (3.5) | (3.4) | (4.6) | (9.2) | (6.7) | (6.5) | (5.5) | (4.8) | (4.4) |
| Current Account % of GDP | (1.8) | (2.1) | (0.9) | 0.9 | (1.2) | (2.0) | (0.7) | (0.6) | (1.0) |
| GFCF % of GDP | 28.2 | 29.5 | 28.5 | 27.3 | 29.6 | 30.7 | 30.8 | 30.0 | 30.0 |
| CPI growth % | 3.6 | 3.4 | 4.8 | 6.2 | 5.5 | 6.7 | 5.4 | 4.6 | 2.0 |
| 10-Year Note % – YE | 7.4 | 7.4 | 6.1 | 6.2 | 6.8 | 7.3 | 7.1 | 6.6 | 6.5 |
| USDINR – Average | 64.5 | 69.9 | 70.9 | 74.2 | 74.5 | 80.4 | 82.8 | 84.6 | 87.0 |
| INR depreciation % | 4.1 | (7.8) | (1.4) | (4.5) | (0.4) | (7.3) | (2.9) | (2.1) | (2.8) |
Source: ELC, MOSPI, RBI, Kotak
Earning growth at 12% going forward
Earning cuts have continued but seems to be bottoming out. Consensus expects 12% earnings growth largely in line with nominal GDP growth.
| Earnings expected to grow at 12% | Negative earnings revision for CY26 and CY27 |
 |
 |
Source: ELC, MOSL, Bloomberg, Avendus Spark
FII flows remained negative for 9M25, leading to a cumulative outflow of $17 billion. Despite this, markets absorbed the selling pressure as domestic MFs deployed inflows of $46 billion.
| FII outflows of $17.5bn in 9M of CY25 | Valuations at the higher end of trading range |
 |
 |
Source: ELC, MOSL
In this note we have a closer look at the IT services Industry – worst performing sector YTD
Is IT services moving from growth to maturity?
IT services companies help organizations leverage technology better – They develop software, modernize IT systems, manage data securely, and guide clients in adopting emerging technologies like cloud and AI. These firms provide specialized expertise, technology solutions, and ongoing support to help businesses improve performance.
The journey for IT services in India started in mid-1990’s in Y2K era. India had a large pool of English‑speaking, cost‑competitive engineers and falling telecom costs, which made remote delivery feasible. After 2001 the industry moved from short‑term staffing to multiyear managed contracts and global sourcing. Over the last two decades providers climbed the value chain to:
- Integrate and manage hardware, software, networking, and storage from multiple vendors
- Handle outsourced IT services – infrastructure management, application maintenance, data centre operations
- Support cloud migration, modernization, and enterprise software (ERP, CRM, etc.)
- Consulting, digital transformation and business process outsourcing
- Build and run data, analytics and AI solutions, including GenAI use cases and model operationalization
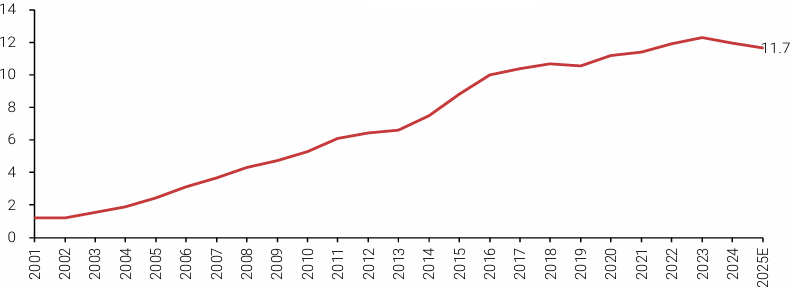
IT services have been a great success story of market share gains from India. From US$50bn in revenues, the sector now has US$285bn in FY25 – contributing 8% to India’s GDP. However recent past growth rates have converged with that of global IT spends.
| Indian IT service growth rate has moderated | Indian IT export market share remains stagnant |
 |
 |
Source: ELC, Kotak
After Covid the industry saw a strong demand for cloud migrations, remote‑work enablement, SaaS adoption and legacy modernization. This has been followed by a decline in growth driven by:
- Unfavorable macro – higher interest rates, tighter corporate budgets and cautious discretionary spend
- Customers channelling IT budgets towards hyperscalers, software and cloud Infra and AI hardware
- Insourcing by setting up GCC’s
- Increased competitive pressure especially for large deals
The industry remains uncertain on two fronts: 1) the implications of GenAI and agentic AI, and 2) whether discretionary IT spending will rebound enough to support large transformation deals. While GenAI is still evolving, the near‑term focus is on macro and geopolitical headwinds that are shaping client budgets.
Over the long run, the key question for investors is whether GenAI will cause a cyclical or structural slowdown. AI is the next major technology wave; the debate is whether it will disrupt the traditional IT services model or create net new opportunities and be overall positive for the industry.
Potential disruption by GenAI / Agentic AI
- Application development, maintenance and customer serving BPO practices
- Core IT tasks and routine workflows are increasingly automatable
- Enterprises may insource capabilities and hyperscalers can move up the stack
- Traditional outsourcing volumes could fall, and margin pressure may rise
McKinsey estimates approximately US$200bn opportunity for tech services over the next five years driven by
- AI-readiness (data, cloud, security)
- Productivity copilots & automation for engineering and support
- Industry-specific AI platforms and vertical models
- Cloud modernization and infrastructure for AI workloads
Consensus expects near term growth rate of low-to-mid single-digit in traditional IT services, but strong momentum in digital consulting and AI transformation projects. Medium term growth would be defined by structural transition as firms rebalance portfolios toward AI and shift revenue mix to higher‑value offerings.
Traditional FTE‑based, labour‑led growth will be challenged by automation and AI, so winners will differentiate through deep domain expertise, advanced AI capabilities and proprietary IP. Firms that bring productized solutions, agile delivery models and strong AI partnerships will capture disproportionate growth.
While the current depressed growth could see a revival if macro improves, longer terms companies have to adopt to the emerging AI disruptions. Even if the pace of adoption of AI is slower than expected, companies will need to adopt to the emerging disruption. There will be winners and losers emerging in the sector. System integrators will have to evolve from managing IT to manging intelligence in the new ear.
Given the slowdown and headwinds from AI, IT services have been one of the worst performing sector YTD. Rather than a broad sector call, there will be stock picking opportunities in the sector. We have initiated a position on IKS Healthcare in our portfolio’s.
Inventurus Knowledge Solutions (Mcap INR 260 bn):
IKS is a business process outsourcing company focused on the physician market in US. The company provides, through its technology platform, a suite of products and services to manage non-core administrative tasks in a doctor clinic chain. Apart from providing medical care, physicians time gets wasted on a number of admin tasks like writing patient notes, coding, dealing with insurance providers for payment etc. In the US, the administrative burden in the healthcare sector has gone up by 400% over the past 20 years, presenting a significant growth opportunity using technology and deep understanding of the healthcare vertical. The total market for clinical and administrative tasks is projected at $250 billion, growing at 8% CAGR. Outsourcing penetration across these workflows ranges from 11-30%, with the outsourcing segment itself expanding at about 12%, driven by process complexity, labor intensity and a shortage of skilled healthcare professionals in the US. Looking at this market opportunity, US$45bn in private equity investments have been made to address the problem.
IKS has developed a platform for 16 workflows across patients life cycle using technology, data and operational expertise. These include tasks like scheduling, financial clearance, patient engagement, clinical documentation, coding, billing, payment posting, denial prevention, document handling, prescriptions and referrals. It uses mainly outcome-based pricing models focused on sharing upsides from revenue enhancement and cost savings.
The company is expected to generate revenues of US$350 million in FY26 which can compound at 15-16% over the next 7-8 years. The company has potential to improve EBIT margins to early-to-mid-30’s from current 29%. We expect the EPS to grow at 25% over the next 5 years. The stock trades at 30x FY27 earnings.